Predicting power outages from space: the data behind grid resilience
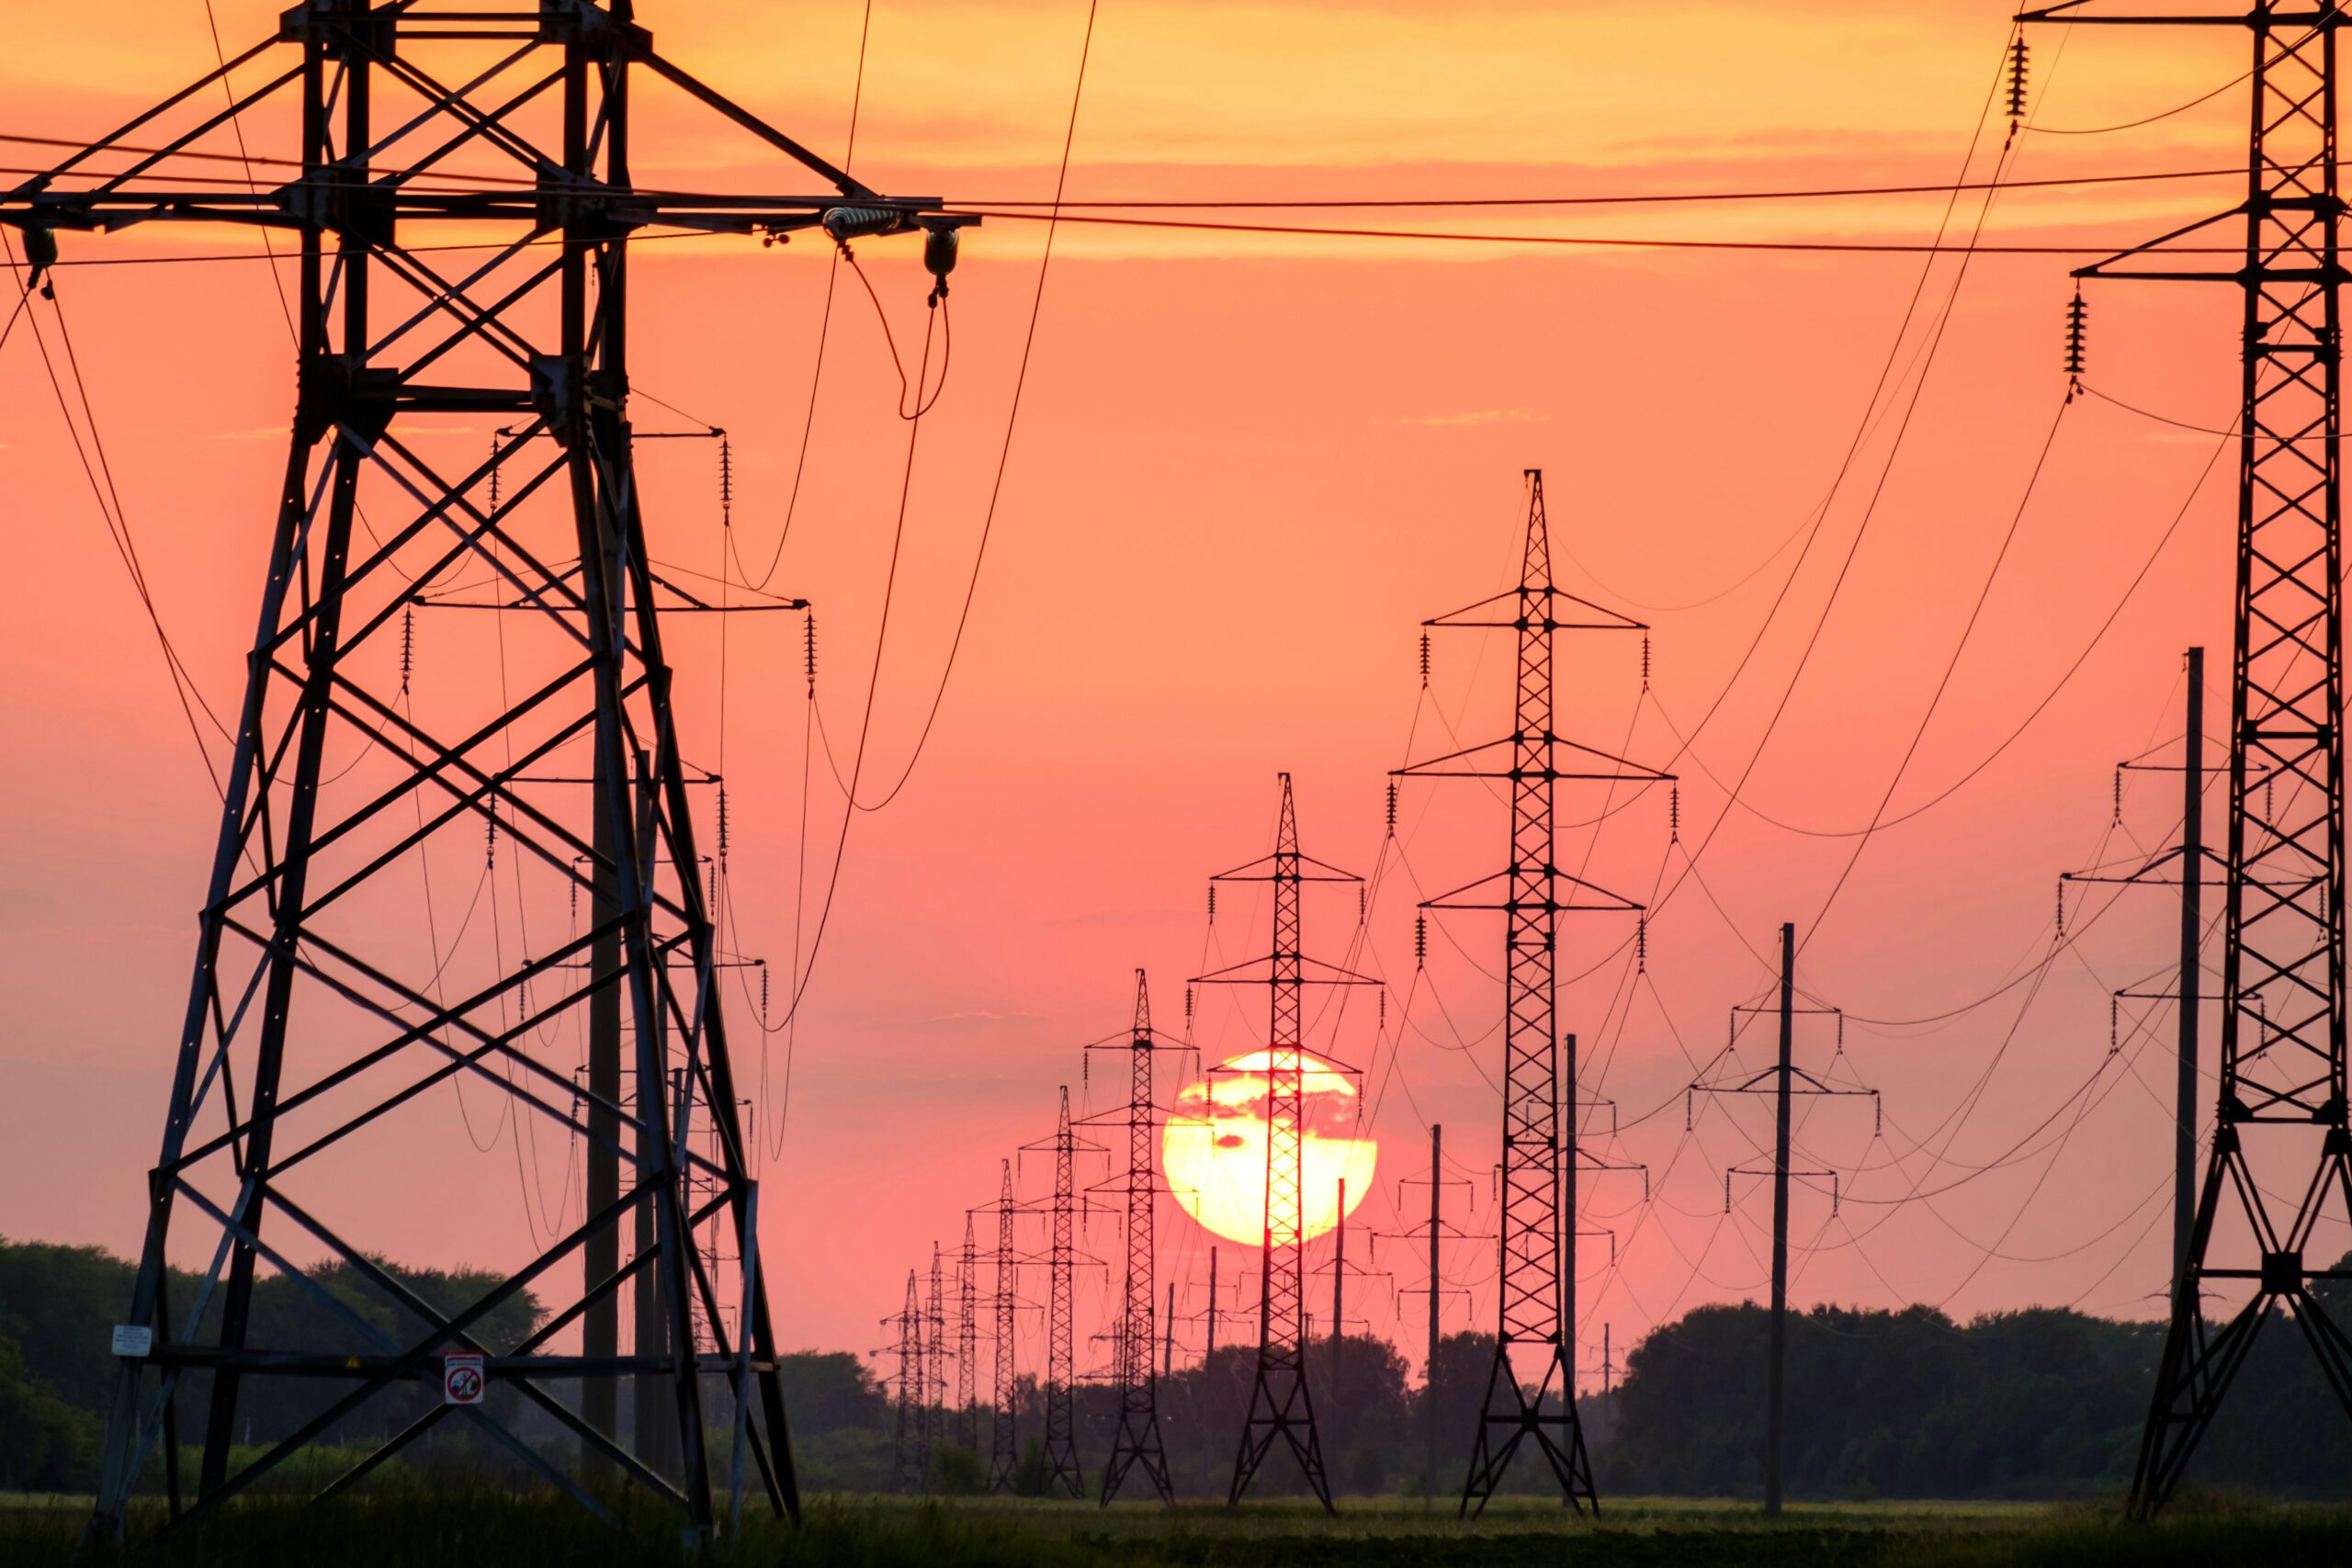
In the last week of June 2026, France recorded its hottest day since national measurements began in 1947. With temperatures climbing past 40 degrees, rivers warmed, and the infrastructure built to keep the lights on began to fail in ways that were, at least on paper, entirely foreseeable. A reactor unit at the Golfech plant in the country’s south was powered down because the river it relied on for cooling had grown too warm to do the job safely. In the north west, a heat-related fault at a transformer left thousands of households in Finistère without electricity, part of a wider issue in which more than a hundred thousand customers lost power across the country as ageing infrastructure met conditions it was never designed for. Other European countries faced similar challenges: from grid alerts in the United Kingdom to a distribution outage in Germany, all due to cooling demand rising sharply at the very moment the supply side could least afford it.
None of this is a surprise in the general sense. Everyone in the energy sector knows that extreme heat stresses the grid, that thermal and nuclear plants depend on cool water, and that demand for air conditioning spikes exactly when generation is most fragile. But the hard part is knowing the details in advance: which transformer, which corridor, which substation, in which week, under which combination of conditions. That gap between knowing the pattern and predicting the exact instance is where a great deal of the damage lives. But it is a gap that Earth observation is increasingly well placed to close. The real obstacle right now is a shortage of the right data to train the models that can turn imagery into foresight.
Grid maintenance is moving from reactive to predictive
For most of its history, grid resilience has been a reactive discipline. Crews are dispatched after a line goes down, vegetation is cleared on fixed cycles whether or not a given span is actually at risk, and infrastructure is inspected on a schedule rather than according to where failure is most likely next. This works but it is expensive and it is always a step behind the weather.
The ambition now is to move upstream: to identify the places and moments where an outage is most likely before it happens, and to direct scarce maintenance budgets accordingly. Satellite data sits at the centre of that ambition because it offers something no ground crew can: a consistent, repeatable, wide-area view of the conditions that precede failure. The question is whether a model can learn to read those conditions reliably. And that, it turns out, depends less on the imagery available today and more on whether we can supply models with examples of the situations that matter most, which are precisely the situations that are rare.
What causes power grid failures during heatwaves
The failures we watched unfold in June were not one problem but several, arriving together. It is worth separating them, because each is a distinct prediction task, and each runs into the same underlying constraint.
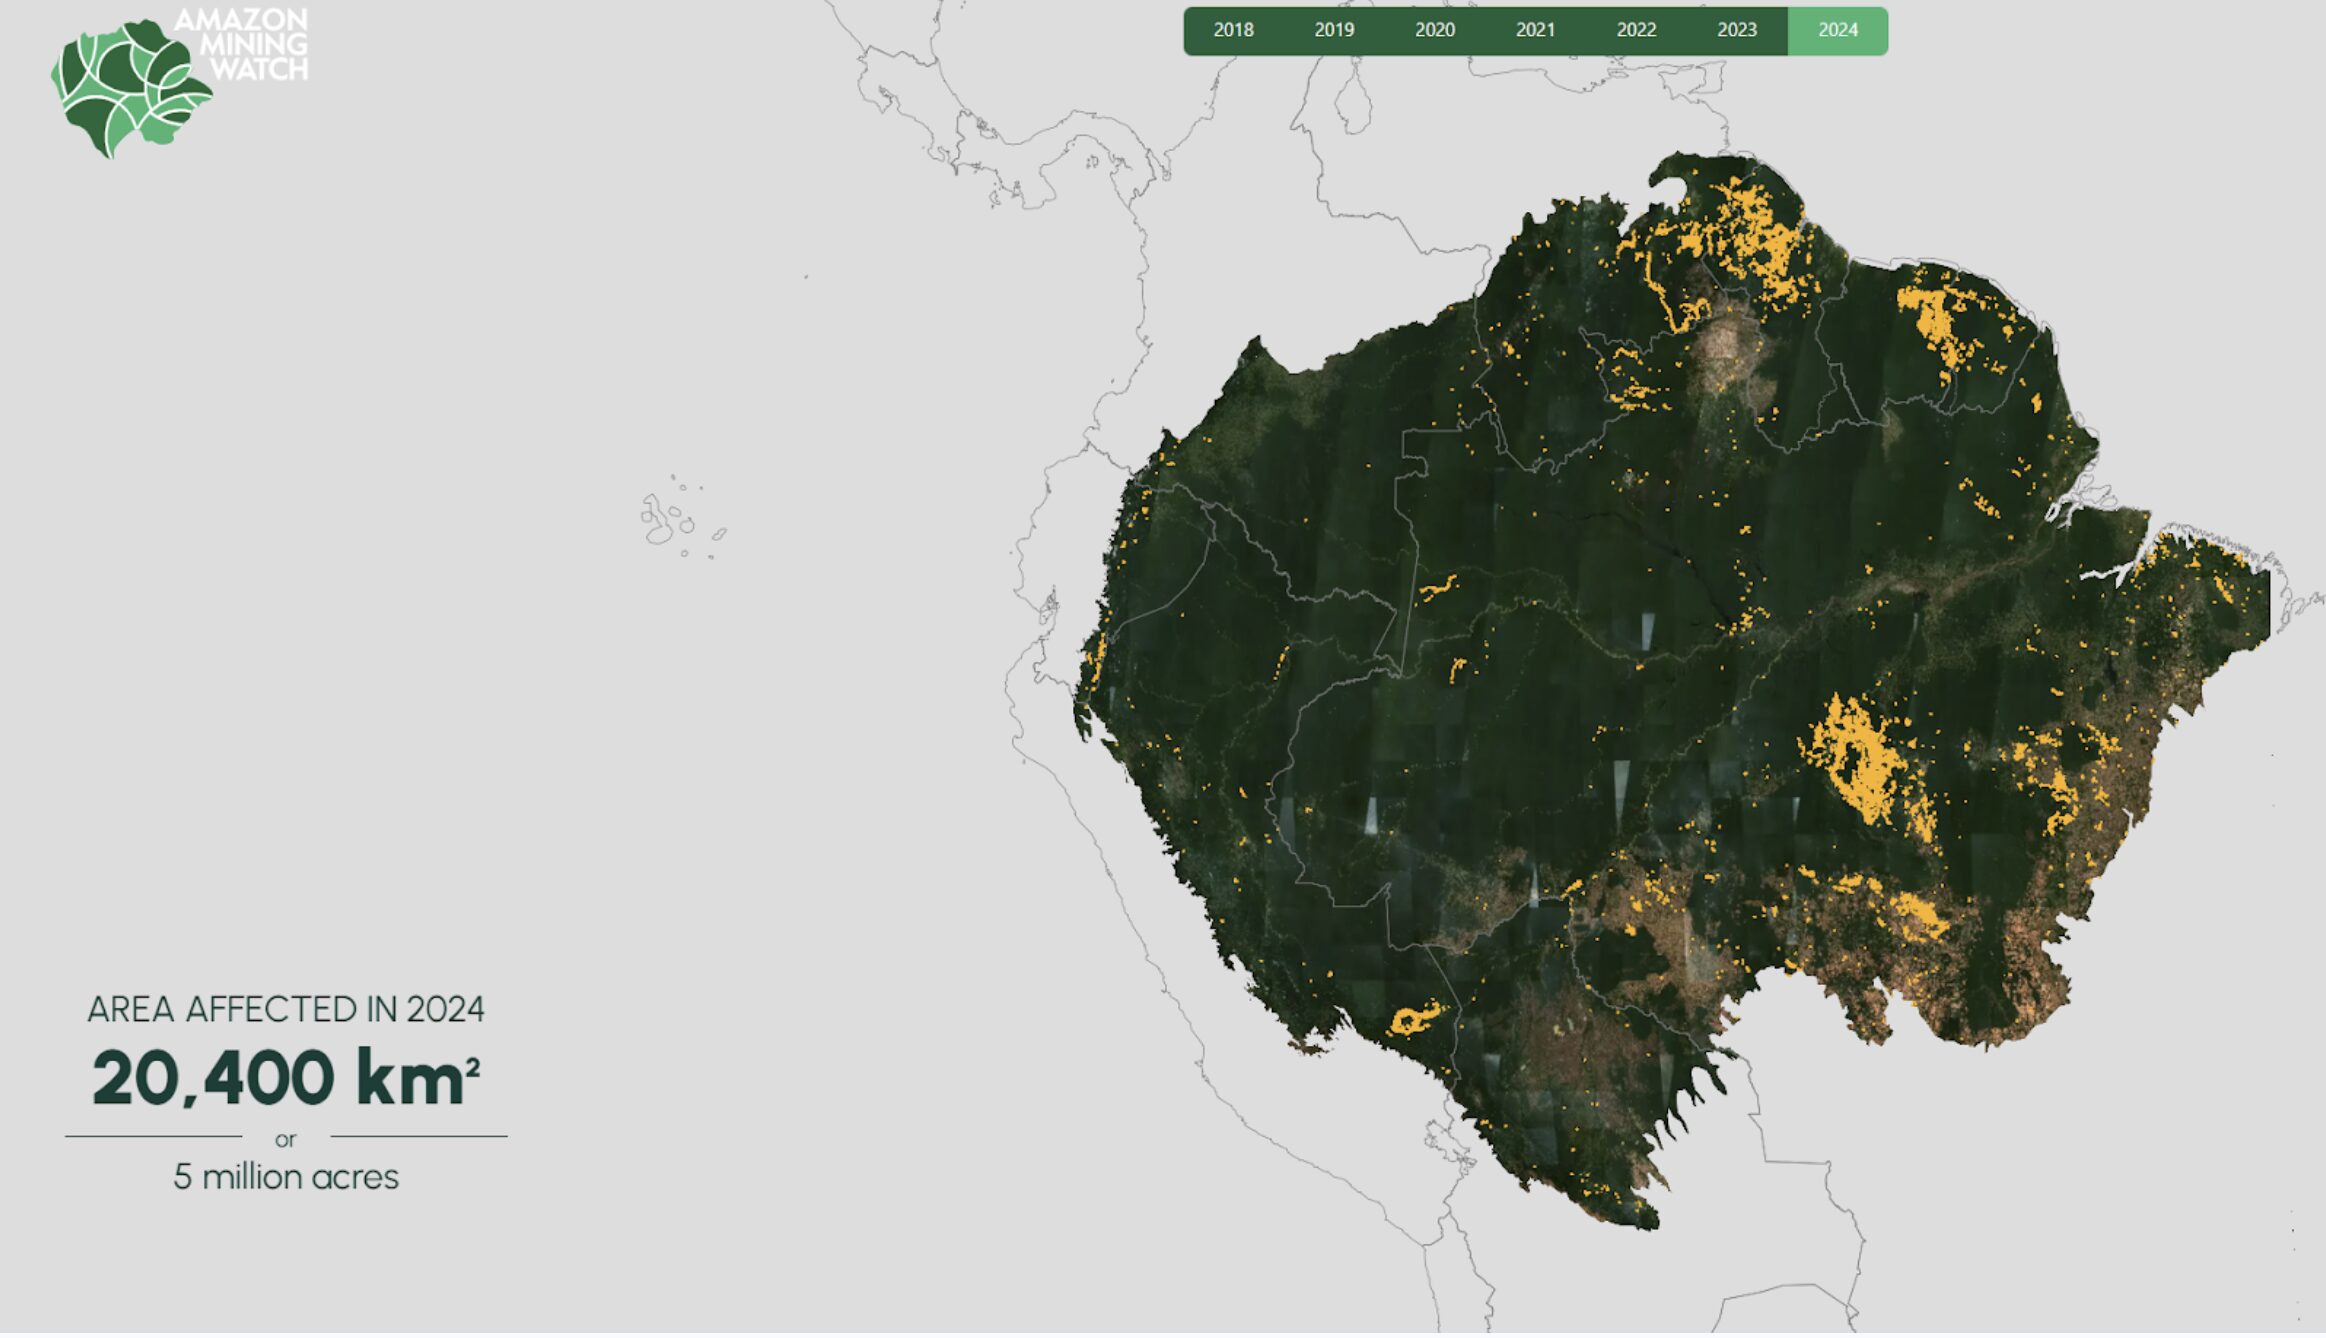
The first is vegetation. Trees growing into lines, and drought-stressed trees falling onto them, remain among the most common causes of outages and, in dry regions, of utility-sparked wildfires. Vegetation risk is not static: it shifts with growth rates, species, moisture content, and the slow rise in tree mortality that a warming, drying climate is driving. Utilities have already begun turning to satellite imagery and machine learning to assess this risk at the level of individual spans and even individual trees, spotting the dead or dying specimens most likely to fail and the corridors where fuel has accumulated. It is one of the clearest cases where a wide-area view, updated often, beats a fixed inspection cycle.
The second is heat stress on the physical infrastructure itself. The Golfech shutdown is the visible tip of this: thermal and nuclear plants that depend on river water for cooling have to dial back or stop when that water grows too warm, a constraint that also cut European hydropower output noticeably during the dry, hot conditions of recent years. Below the level of generation, the distribution network suffers its own heat injuries. Transformers overheat, conductors sag as they expand, and components age faster under sustained thermal load. These are physical processes that leave observable signatures: in surface temperature, in the state of the surrounding land, in the thermal behaviour of assets. Reading those signatures as a probability of failure is the harder step.
The third is the broader question of grid vulnerability zones, the places where a demand spike meets weak infrastructure. During the June heatwave, daily power demand rose by double digits in places as cooling load surged, while some generation sat offline for maintenance or heat limitations at the same moment. The danger is when heat and demand hit the same weak point at once. Mapping those zones means combining what satellites can see of the physical environment with an understanding of where stress concentrates, and it means being able to model conditions that have not yet occurred but could.
The fourth is deliberate: geopolitical and physical threats to infrastructure. This is no longer a hypothetical for Europe. An industry report earlier this year documented an accelerating pattern of sabotage, aerial intrusion and subsea cable damage against energy assets, and the specific incidents are now numerous, from a suspected arson attack on pylons that cut power to tens of thousands of Berlin households in the autumn of 2025, to the severing of a power cable in the Gulf of Finland at the end of 2024. These events are, by their nature, engineered to be rare and unexpected, which makes them close to impossible to learn from using historical records alone. Yet the physical vulnerability of a given asset, how exposed it is, how observable, how quickly damage would show, is something remote sensing can help characterise in advance.
What unites all four is the shape of the data problem behind them. In every case, the events that matter most are the ones that happen least.
Rare events and the limits of satellite data
This is the quiet problem at the centre of predicting anything from space. Satellite archives hold enormous volume, and the balance sits in the wrong place. They are rich in the ordinary and thin in the extreme. For every thousand images of a grid running under calm skies, there is barely one of a transformer failing in a heatwave. The record is a poor teacher for the events it has hardly seen.
That scarcity compounds in three ways. First, when rare events do appear in the imagery, someone still has to find and label them by hand, which is slow, costly, and prone to its own errors, and there is simply not enough labelled material to go around. Second, the moments of greatest interest are frequently the moments when optical satellites can see least. Storms, fire fronts and extreme weather bring cloud and smoke, so the archive is not just sparse at the crucial moment, it is often obscured. Third, a model trained on ordinary conditions tends to fail at the edges, generalising poorly to the unusual case, which is the one that causes the outage.
The result is a field that can monitor the present well and struggles to anticipate the exceptional. And the exceptional is what a resilient grid needs to be ready for, all the more so as climate change makes yesterday’s hundred-year event a regular fixture and as deliberate threats add a category of risk that has almost no historical baseline at all.
Synthetic satellite data for predicting grid failures
Synthetic satellite data offers a way to overcome these challenges. It is imagery built to behave like the output of a real sensor, generated rather than captured. Because the scene is constructed, everything in it is known, and every object carries an exact label at no extra cost. That reverses the usual bind, where the rarest and most valuable events are the hardest to find and the hardest to label.
This widens what a model can learn from. You can build a corridor where vegetation closes on a line under drought, across any season or moisture level. Instead of waiting years for a real transformer to fail in the heat and be recorded, you can simulate the slow build towards one and run it as many times as you need. You can even create the events no one wants to wait for, a flood at its peak or a fire front at its worst.
Simulation is what makes this work. A synthetic environment models how heat, drought and load play out across a stretch of network, and produces a full spread of outcomes rather than the thin slice reality happens to record. The model studies the emergency before it arrives and learns the signs of a failure that has not happened yet. For rare threats, this is the only honest way to give a model real experience of them in advance. Real imagery is still the foundation. The best results come from using both, real data to keep the model grounded and synthetic data to cover what it misses, with every model checked against real scenes before anyone trusts it. Together they close the gap where prediction fails.
The future of predictive Earth observation
The failures of June 2026 showed the conditions our infrastructure faces drifting past the limits it was built for, and doing so faster than the record can follow. Heatwaves once called exceptional now return each summer. Drought stress on vegetation is climbing. Attacks on energy infrastructure have moved from scenario planning into the news. In each of these, prediction is held back by the same thing: a shortage of the specific, well-labelled data that describes the rare and the extreme.
As Earth observation moves from watching what happens to anticipating what will, the power to build the missing data, with exact ground truth, may come to matter as much as the power to capture it. For a grid that must be ready for the outage still to come, that shift cannot arrive soon enough. Seeing the next failure before it lands depends on having shown a model what that failure looks like. Sometimes the only way to do that is to build it.
Another Earth generates high-resolution synthetic Earth observation data, designed to train and test the AI models used across environmental, infrastructure and climate work. Our aim is to help organisations move from reacting to what has already happened towards anticipating what comes next, by building the predictive data layer for the physical world.

Leave a Reply