
Where solar goes: satellite data and the site-selection problem
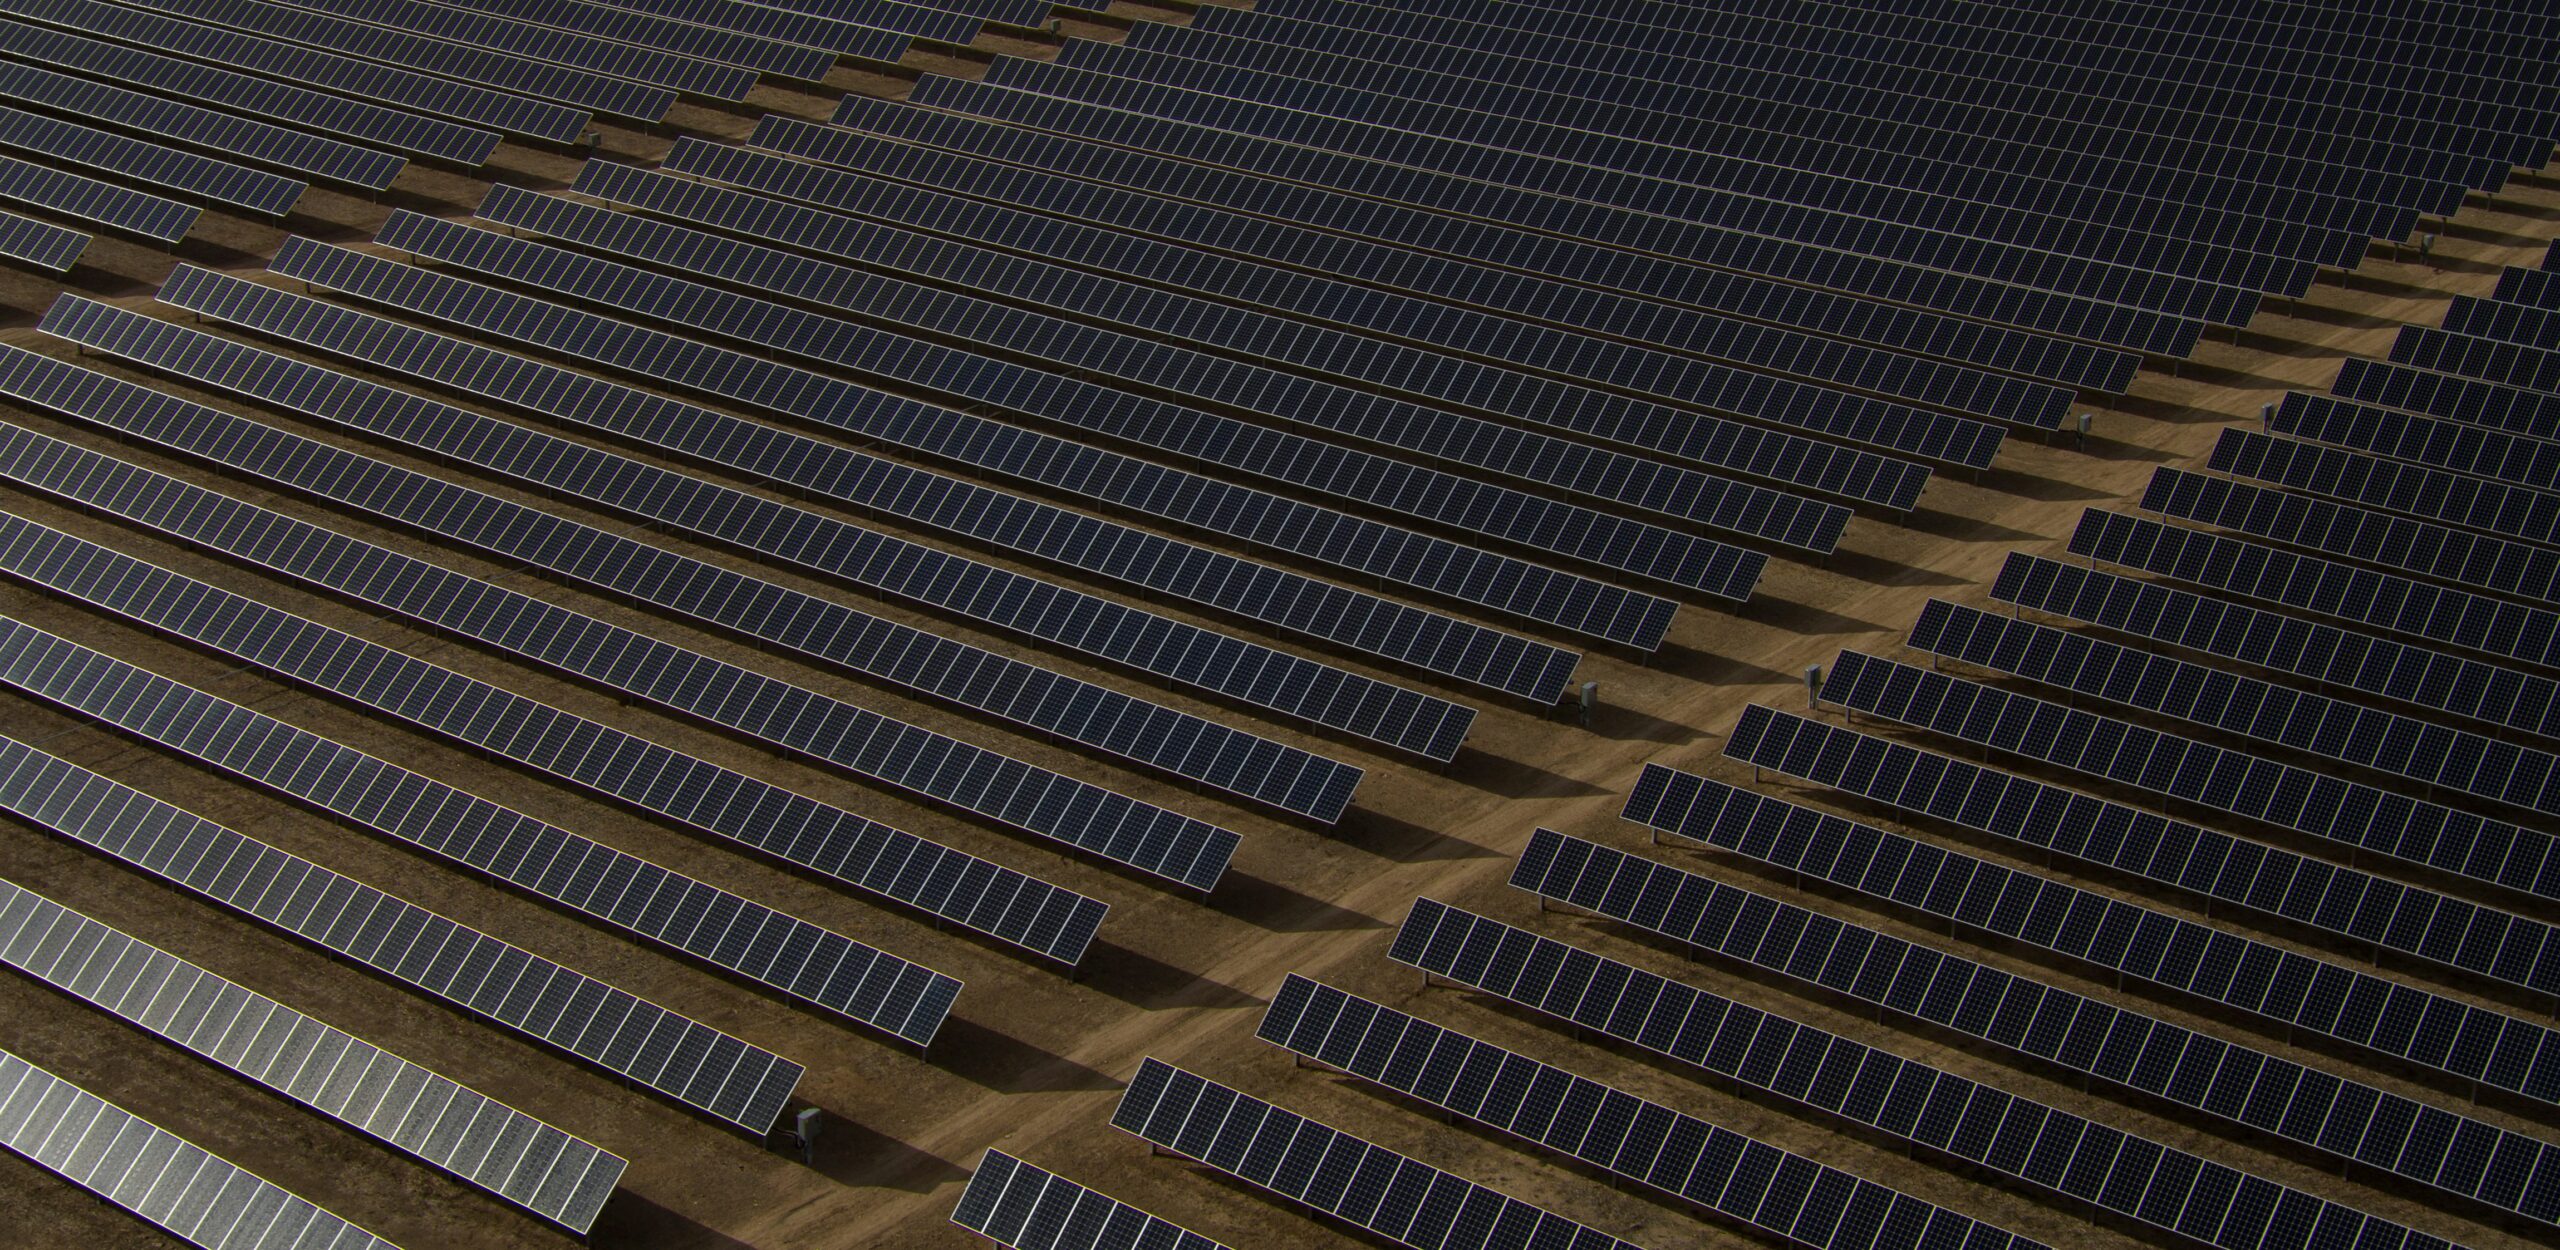
Somewhere in the United States, a finished solar project is waiting. The environmental review has passed, financing closed long ago, the land is leased and the equipment is specified. The one thing missing is a letter from a utility confirming there is room on the grid. Lawrence Berkeley National Laboratory, which tracks these queues every year, found that for the projects built in 2025 the median wait from that first request to actually generating electricity ran beyond five years1. Most projects never reach that point at all: of all the capacity that entered US queues between 2000 and 20201, only 13 per cent had reached operation by the end of 2025, while three quarters had withdrawn. By the close of 2025 the active queue held more than 2,000 gigawatts, roughly twice the country’s installed fleet.1
Two things have sharpened the stakes lately. Demand is climbing faster than the grid can absorb it, with data centres, electrification and new manufacturing behind forecasts of well over a hundred gigawatts of additional capacity needed within five years.2 And the rules for entering a queue have tightened: under the reforms now rolling out, a developer has to show real site control and technical readiness simply to hold a place in line, rather than filing a speculative request and refining it later.1 Both changes push the same decision earlier and make it heavier. Where to build now has to be substantially right before a project is even in the queue.
That decision, on which parcel to commit to, is becoming one of the most consequential in solar development, and one of the easiest to get wrong. The root of most later delays is rarely a shortage of sunlight. It is a site chosen before its real constraints were understood.
What actually decides a site
What makes a parcel a strong candidate goes well beyond sunlight, which is what most people picture first. Irradiance is the first essential and also the most straightforward: the data is abundant, well understood and freely available almost anywhere in the world. It is bankable now too, but more on that later.
The factors that actually decide a site are the ones that never appear on an irradiance map. Slope and terrain can turn a straightforward build into an engineering and financial problem. The next question is who and what already lives on the land: an endangered species discovered too late can hold a project for years, and neighbouring communities or farmers can object to protect their surroundings or their livelihoods. Local opposition of this kind, often described as energy sprawl, has become one of the more common causes of permitting delay. And then there is the grid itself: how far the nearest substation sits, and whether that line, or the next one, has any capacity left to take a new project at all.
Every one of these can overturn the plan for the sunniest spot, and none of them is visible in an irradiance figure. Most of them, though, can be read from satellites. With Earth observation and machine learning it is now possible to screen entire regions in the time it once took to visit a handful of parcels, which has changed the economics of early development. Site visits still matter, but they come after the desktop picture is built, so teams go only where it is worth it.
Even so, poor site decisions are still made, and projects still die in queues. Part of the reason sits in how the land itself is read.
There is no land shortage, only a detection problem
The instinct is to treat land as the binding constraint. Recent work suggests otherwise. A study published this year in Joule, built on satellite mapping of nearly 69,000 solar installations across 65 countries, found that reaching net zero with high growth in solar would take a negligible share of the world’s land, on the order of a tenth of a per cent by 20503. The shortage is not land. It is the ability to find the right land, and to recognise the disturbed ground that could be used instead of converting something new.
The same research points to the land-sparing value of rooftops and brownfield sites. A capped landfill, an old quarry or a stretch of disused industrial land is already disturbed rather than newly converted, and such sites often sit close to existing grid infrastructure, because industry was built where power was. They also tend to attract far less local opposition than open fields. The difficulty is that a sound rooftop or a usable brownfield is much harder to identify than a plain green field. It calls for working out roof type and condition, or reading a narrow, specific band of industrial land cover, and that depends on exactly the kind of well-labelled examples that remain scarce for these less conventional sites.
The weak points in reading a site
All of this, reading the terrain correctly and picking out rooftops and brownfields that no one has systematically mapped, rests on trusting what the satellite shows. That trust has specific weak points, and each traces back to something already mentioned.
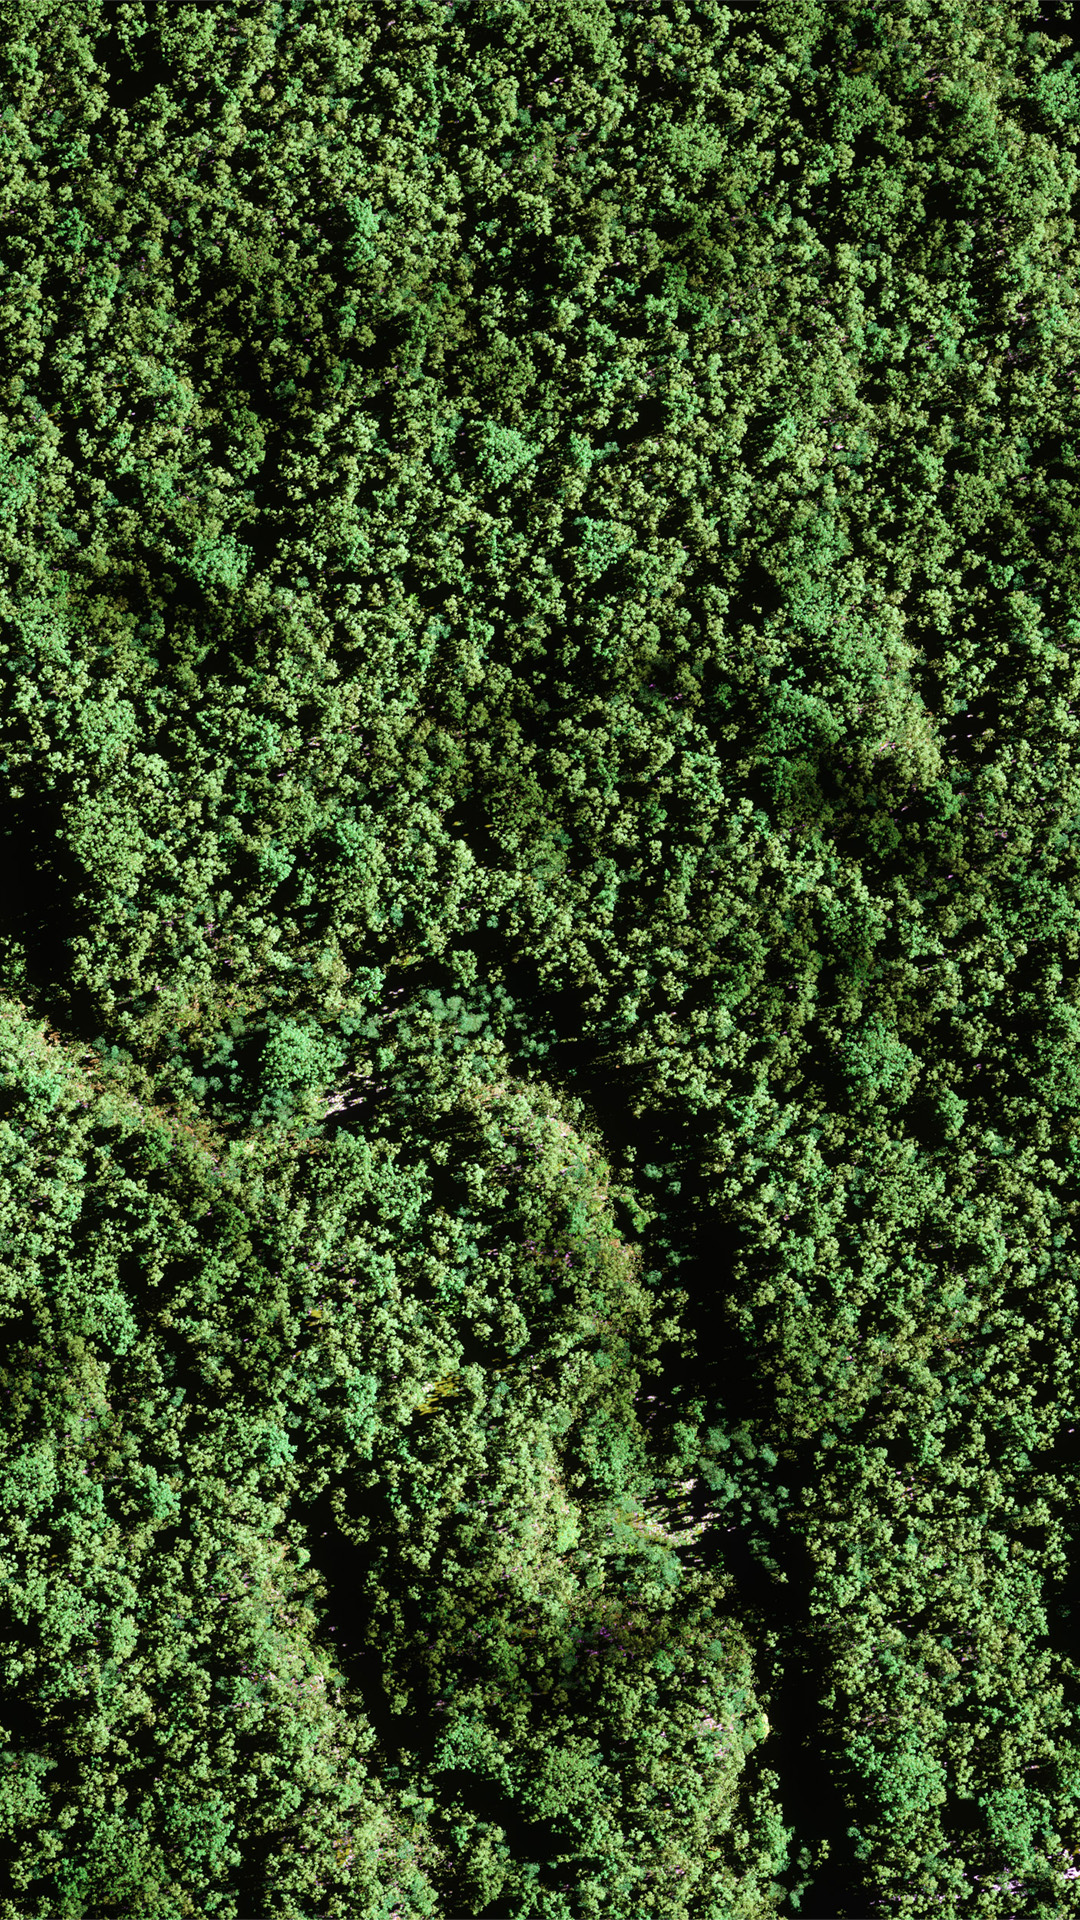
Start with whether there is a usable image at all. Cloud cover, sensor artefacts and atmospheric interference leave real holes in a site’s satellite record, and in parts of the tropics a clear view of the ground can be hard to obtain. The hardest part of teaching a model to see through cloud has always been the lack of matched examples: you almost never have the same place, at the same moment, photographed both with cloud and without, so there is nothing clean to learn from. Synthetic satellite data removes that constraint, because the same scene can be generated twice, once clear and once under cloud of any type or density, giving a model perfectly paired examples. Published work has shown that cloud detection and removal models trained only on synthetic cloud can approach the performance of the same models trained on real imagery. Two established techniques close the gap from the other side: fusing radar, which passes through cloud, with the optical record on either side of a gap, and filling shorter gaps using a region’s own surrounding history. Neither invents information. Both turn a patchy archive into something closer to continuous, which is what a long-term decision needs.
Then there is reading the image correctly. Telling good farmland from bad, or a sound roof from a compromised one, needs a model that has learned the difference from real examples. The scarcity is not pictures; satellites photograph the whole planet on a schedule regardless of how much solar a country has built. The scarcity is labelled examples, where someone has marked precisely what the slope is at a given point, what the land cover is, where a roofline sits. That work is slow and costly, and it has mostly been done for places that already have plenty of solar, because that is where the incentive appeared first. A model trained mainly on carefully labelled sites in the US or Europe carries that bias wherever it looks next. Synthetic data sidesteps this, because it arrives with its labels already attached: whoever generated the scene knows exactly what is in it, the slope, the vegetation, the edge of every roof, and no one has to trace it by hand afterwards.
The same desktop data usually feeds the first pass at sizing what gets built, and that is where a subtler weakness shows. A geostationary weather satellite images a site every five to fifteen minutes, which sounds frequent until you remember that a single cloud can take an array from near full output to almost nothing in under a minute. A yield model built on that native cadence smooths straight over the rapid swings that determine how large a battery needs to be, or whether an inverter will clip on the recovery spike once the cloud passes. Recovering that sub-minute detail is, once again, a paired-data problem, and the same synthetic cloud fields that teach a model to see through weather can supply it.
Why sunlight is bankable and everything else isn’t
It is worth ending on irradiance, the easy factor this piece opened with, because it shows what solved actually looks like. Lenders want decades of validated irradiance before they will finance a plant, and for years the only way to get numbers a bank would trust was to place a ground station on site and wait. That wait has largely gone. Satellite-derived irradiance records now reach back more than twenty years for most of the world, and a technique called site adaptation corrects that long record against a few weeks of local measurement, turning a multi-year wait into a matter of months. The irradiance question is, in effect, answered.
Everything else a lender or a permitting authority asks about a site has not caught up. The terrain, the land use, the rooftops, the vegetation creeping over a roofline: these are the judgements that still stall projects, and they are the ones that depend most on trusting what a model sees. That is precisely what synthetic data is built to strengthen. It supplies the labelled, perfectly matched examples that are missing wherever the real archive runs thin, so a model can learn to read a slope, a roof or a clouded scene correctly before a project is committed, rather than after it fails. Irradiance got its bridge from ground data. For everything else, synthetic data is the bridge.
The first choice sets the rest
Everything that follows, permitting, financing, the interconnection study and years of operation after that, inherits whatever was decided at this first step. That was always true. It matters more now that a developer has to prove a site is ready before joining a queue that already stretches past five years, in a market where demand is rising faster than the grid can take it. Choosing well will not guarantee an easy run. Choosing badly comes close to guaranteeing a hard one. The tools to get the decision right, and the data quality to make them trustworthy, already exist, and none of them require waiting for a project to fail first.
Another Earth generates high-resolution synthetic Earth observation data, designed to train and test the AI models used across environmental, infrastructure and climate work. Our aim is to help organisations move from reacting to what has already happened towards anticipating what comes next, by building the predictive data layer for the physical world.
[1] Lawrence Berkeley National Laboratory, Queued Up: 2026 Edition
[2] Grid Strategies, load-growth forecast, November 2025
[3] Jordaan et al., “Global land and solar energy relationships for sustainability,” Joule (2026)


Leave a Reply