A physical risk model can tell an insurer how deep the water would reach at a single address in a severe flood, how hard the wind would hit it in a storm, or how intensely a fire would burn there. Models of this kind have improved substantially over the past decade, particularly for flood. The better ones now describe the hazard at a location to within tens of metres, under different climate scenarios and decades into the future.
Ask the same model what is standing at that address and it cannot tell you much. It will rarely know how the building is constructed, what its roof is made of, how close it sits to the next structure, or what condition any of it is in. That side of the calculation, the inventory of what is physically there and what it is worth, is called exposure. Where those details are missing, and they usually are, the model works with an average instead, an assumption about what buildings in that region are generally like.
The insurer multiplies the two together to arrive at a price. An average works reasonably well across a large portfolio, where individual errors offset one another. It works much less well for a single asset, which is exactly the level insurers are now being asked to price, report and plan at.
How a loss estimate is built
A catastrophe model answers three questions and multiplies the answers together. Hazard asks how severe the dangerous event is at this location and how often it occurs. Exposure asks what is physically there and what it is worth. Vulnerability asks how much damage that particular thing takes when the event happens. A tile-roofed house with cleared ground and four metres to its neighbour behaves differently from a house with a wooden deck and a tree overhanging the roof, in the same fire.
The three components have not advanced at the same rate. Most of the investment of the past decade has gone into hazard. With historical claims no longer predicting future losses, the industry needed something forward-looking to replace them with, and invested heavily in flood models, high-resolution terrain data and climate scenario projections. Those models have their own limits, particularly for events too rare to have left much of a record, but the field is advancing quickly and has the funding behind it.
Exposure and vulnerability received far less of that investment, and the shortfall is visible in the data insurers work with. Fathom, whose flood models are used widely across insurance and reinsurance, notes that in regions with smaller insurance markets or newer perils, submissions frequently arrive as aggregate figures carrying very little detail about the individual buildings covered. These two components change the final loss estimate as much as the hazard figure does, so thin information here damages the result just as much as a weak hazard model would.
The reason for this is simple. For most buildings, nobody has written down what they are. There is no systematic record of what each structure is made of, how it is built, or what sits around it, and without that record there is nothing for the model to use except the regional assumption.
The property attributes that predict damage
Research into why some houses survive a wildfire and others do not has produced a consistent and slightly counterintuitive answer. Studying more than 40,000 structures exposed to Californian wildfires between 2013 and 2018, researchers found that the distance a homeowner had cleared around the property explained very little of the difference in survival, while the characteristics of the building itself explained considerably more. Analysis of the 2018 Woolsey Fire pointed the same way. It identified building materials and the surrounding layout, including how much of a plot was paved and how densely built the area was, as the strongest predictors of loss.
What decides the outcome, in other words, is a set of ordinary physical facts about the property. What the roof is covered with and what shape it is. How close the nearest building stands. How much of the plot is paved or bare. What grows over the roof. How many storeys there are, and what has been added since anyone last recorded the property. These are the vulnerability attributes that move the result most and are often the ones missing from an insurer’s records.
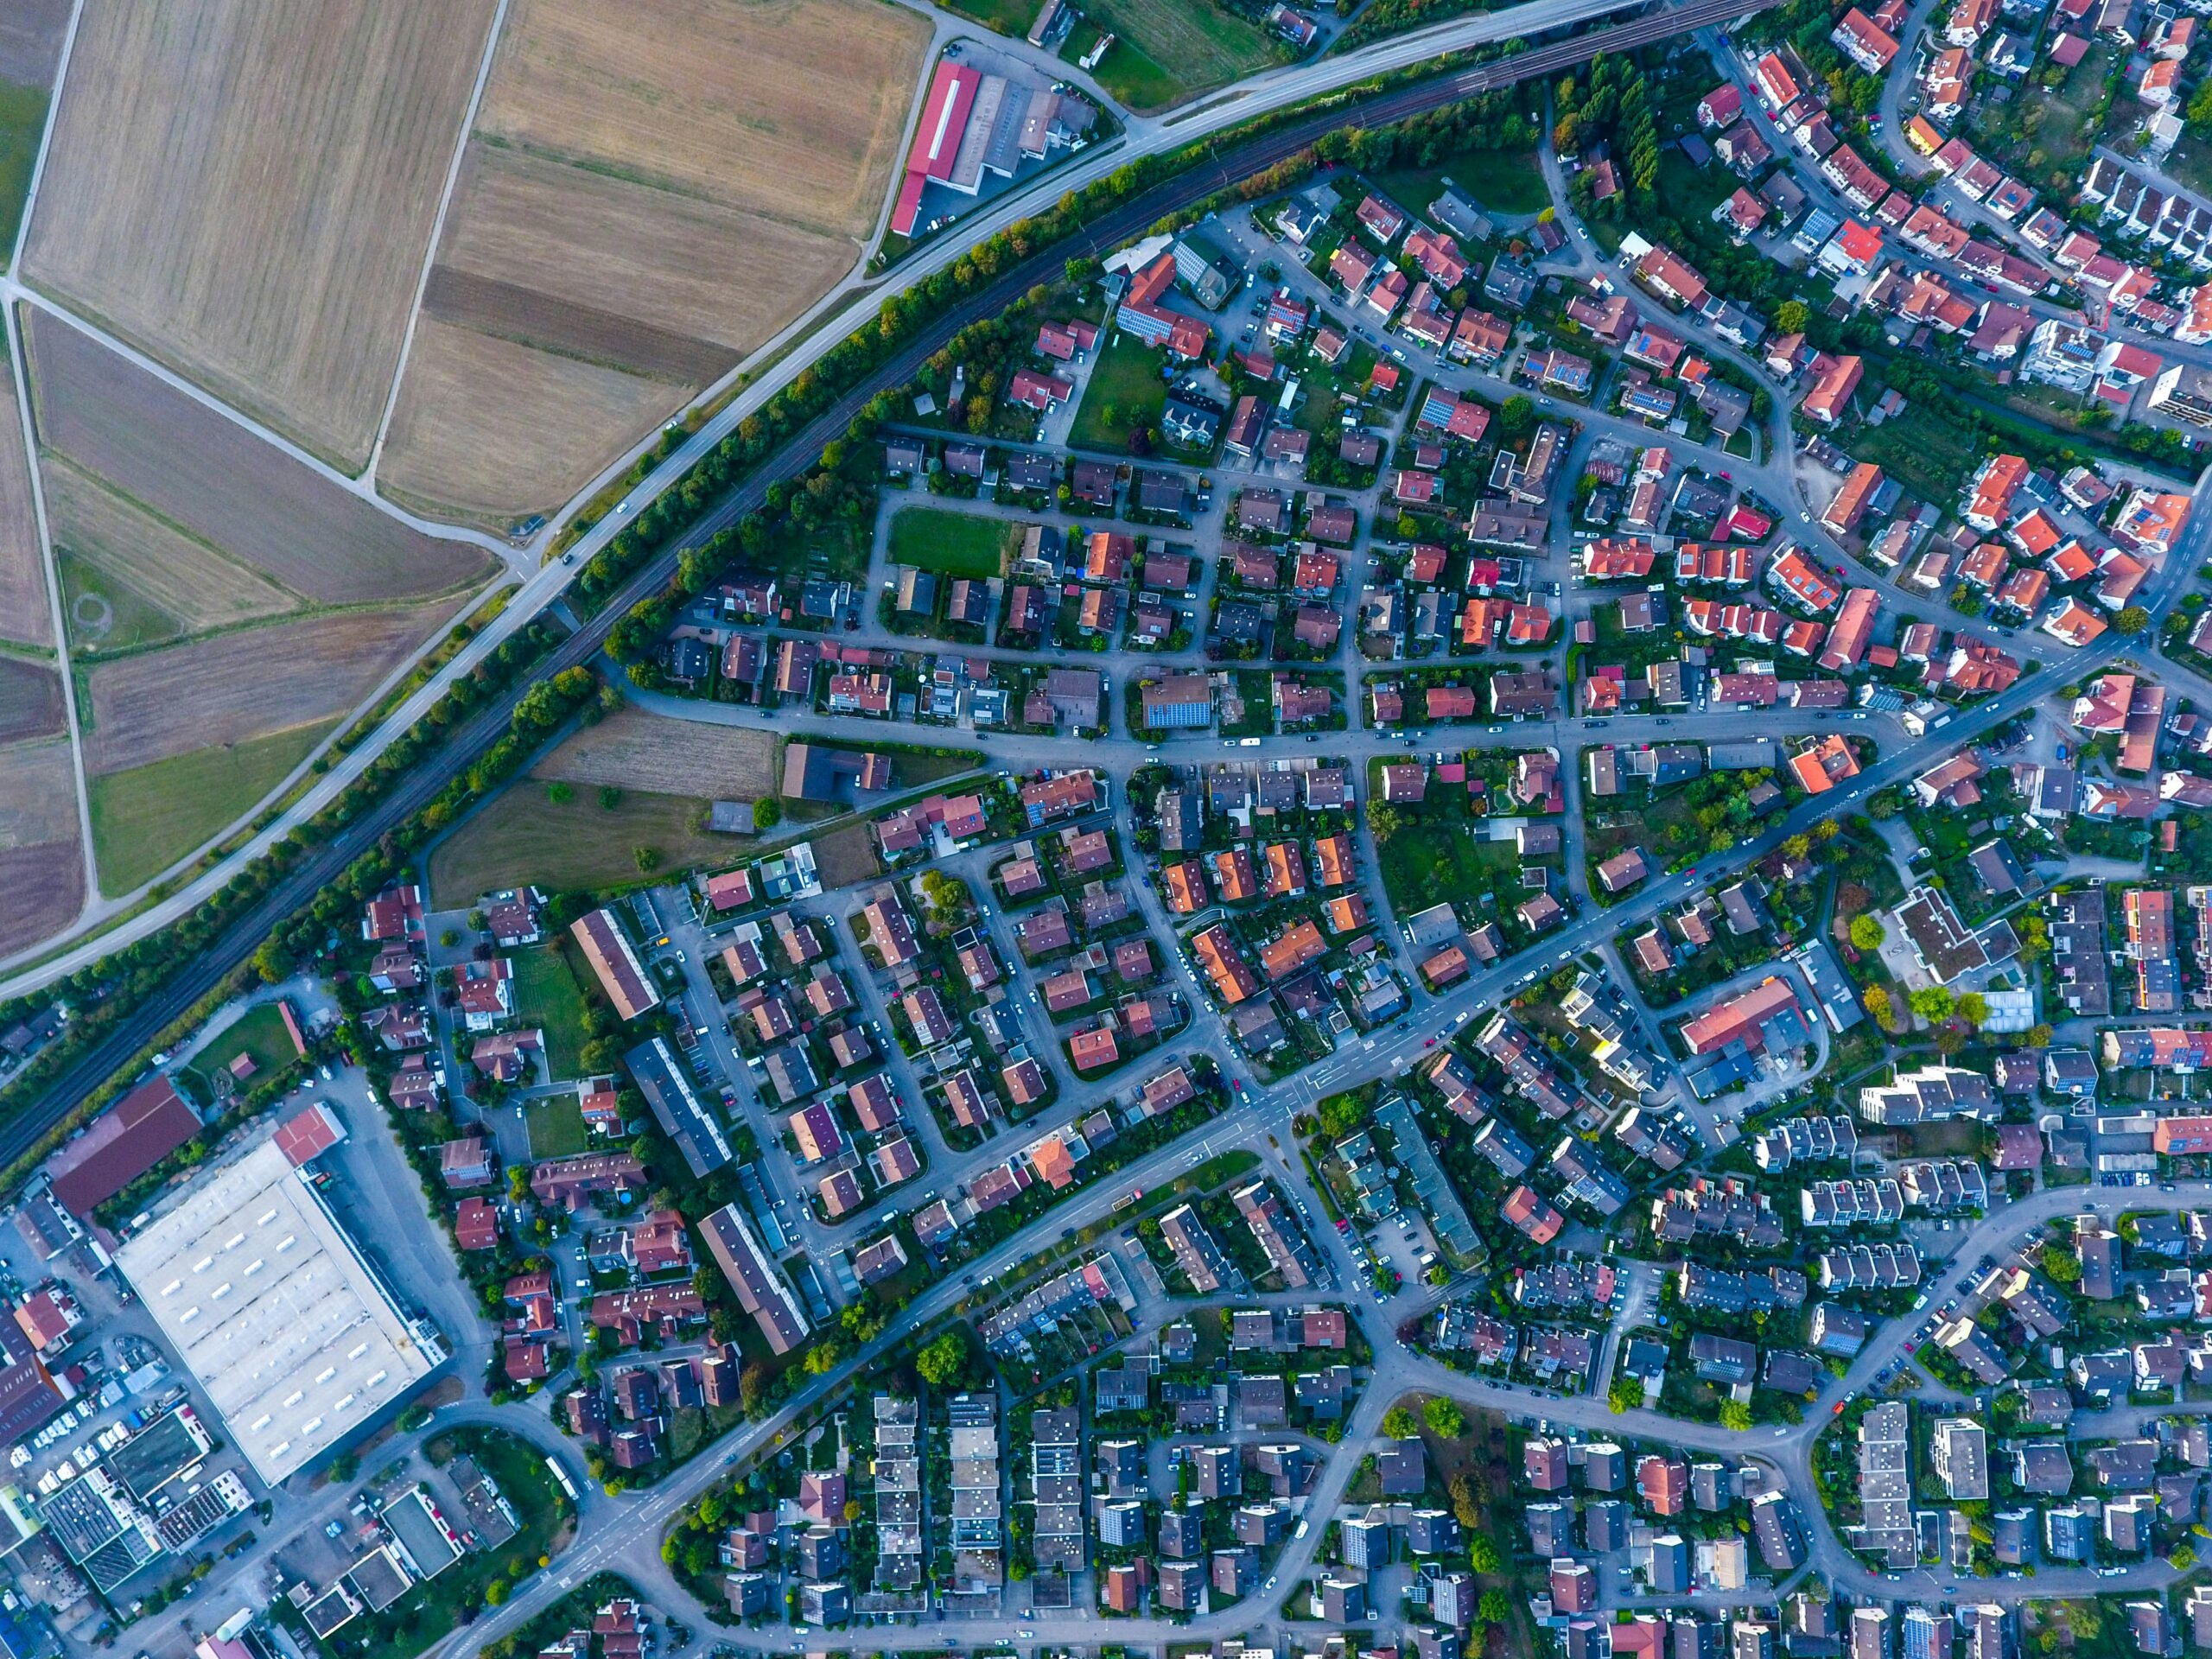
All of these factors are visible from above, which is what makes them collectable at the scale of a portfolio. Reading them out of imagery covers hundreds of thousands of properties in the time it would take to visit a few dozen.
In some markets this is already happening. High-resolution aerial imagery is captured across an area, software reads the roof material, the roof condition and the vegetation around each building out of it, and insurers buy the results. They use them to check what a customer said about the property and to decide which houses are worth an inspection.
Training data for property risk models
Software that reads a roof out of an image has to be taught, and it is taught by example. Annotators work through several thousand images, delineating each building footprint and assigning it a class: corrugated metal, clay tile, damaged. Those annotations are the training data, and producing them is slow, expensive work that depends on people who can interpret what they are looking at.
The examples also have to come from the region the model will operate in. A model trained on one building stock has learned what that stock looks like from above, and applying it elsewhere means applying it to a different subject: different materials, different roof geometries, smaller or larger structures, denser and more irregular street patterns. The effect has been measured. A model built to detect building damage can lose up to 30 per cent of its accuracy when applied to a disaster outside the ones it was trained on, and an analysis published this year traced the cause to the buildings themselves, finding that what breaks these models is how the structures are built and how they sit in relation to what surrounds them.
A model that is to work in a new region therefore needs its own annotated dataset, built from the buildings of that region and produced by hand. Until that dataset exists, an insurer operating there prices on the regional average.
What changes when the training data is generated
There is another way to arrive at an annotated dataset. The scene can be built from the start. A synthetic satellite image is generated for the area, the structures are modelled in three dimensions, and each one is placed into the scene deliberately. Every object is put there on purpose, so its class, its footprint and its position are known by the time the image is rendered, and the annotation exists as part of the scene itself.
With this method, training data can be created for regions that have none. The scene is specified to match the building stock the model will work on, down to the construction materials, the shape of the roofs, the size of the plots and the way the streets are laid out. It also means the content can be chosen around the task: an insurer training a model to read separation distance needs scenes built for that, and one training a model on roof condition needs a different set. The same attribute can be varied across otherwise identical structures, which is how a model learns to measure a property instead of simply registering that it is there.
The model that comes out of this reads individual buildings. Pointed at real imagery of a portfolio, it returns the roof material, the condition and the surroundings for each address, which is the information the vulnerability side of the calculation has been missing.
What this makes possible
Once the attribute data exists, the questions an insurer settles with a regional assumption become questions about the building itself. A portfolio can be read property by property: which risks are better than their postcode suggests and can be held at a price that keeps them, which are carried at the wrong premium, and which addresses justify the cost of an inspection. Those are decisions with money attached, and each of them improves as the description of the building improves.
Another Earth generates high-resolution synthetic Earth observation data, designed to train and test the AI models used across environmental, infrastructure and climate work. Our aim is to help organisations move from reacting to what has already happened towards anticipating what comes next, by building the predictive data layer for the physical world.